For the first month of durandeau.com, my audience dashboard counted 2,517 page views. After three corrections, 110 were left, coming from 45 distinct networks. A factor of twenty-three. Neither number came from a faulty tool: both come from the same logs, read with different rules. So the interesting question is not which tool lies, but which of the two numbers I could defend to someone who asks how I got it.
Measuring without a tracker
The measurement uses no tracker. No script on the visitor's side, no cookie, no banner. The source is the web server's logs (Caddy), with addresses truncated before they are written: to the /24 in IPv4 and the /48 in IPv6. That is why I count networks, not people. Behind it, DuckDB aggregates and Evidence displays, a choice made mostly to learn Evidence rather than reach for Power BI again. The repository started on 16 August.
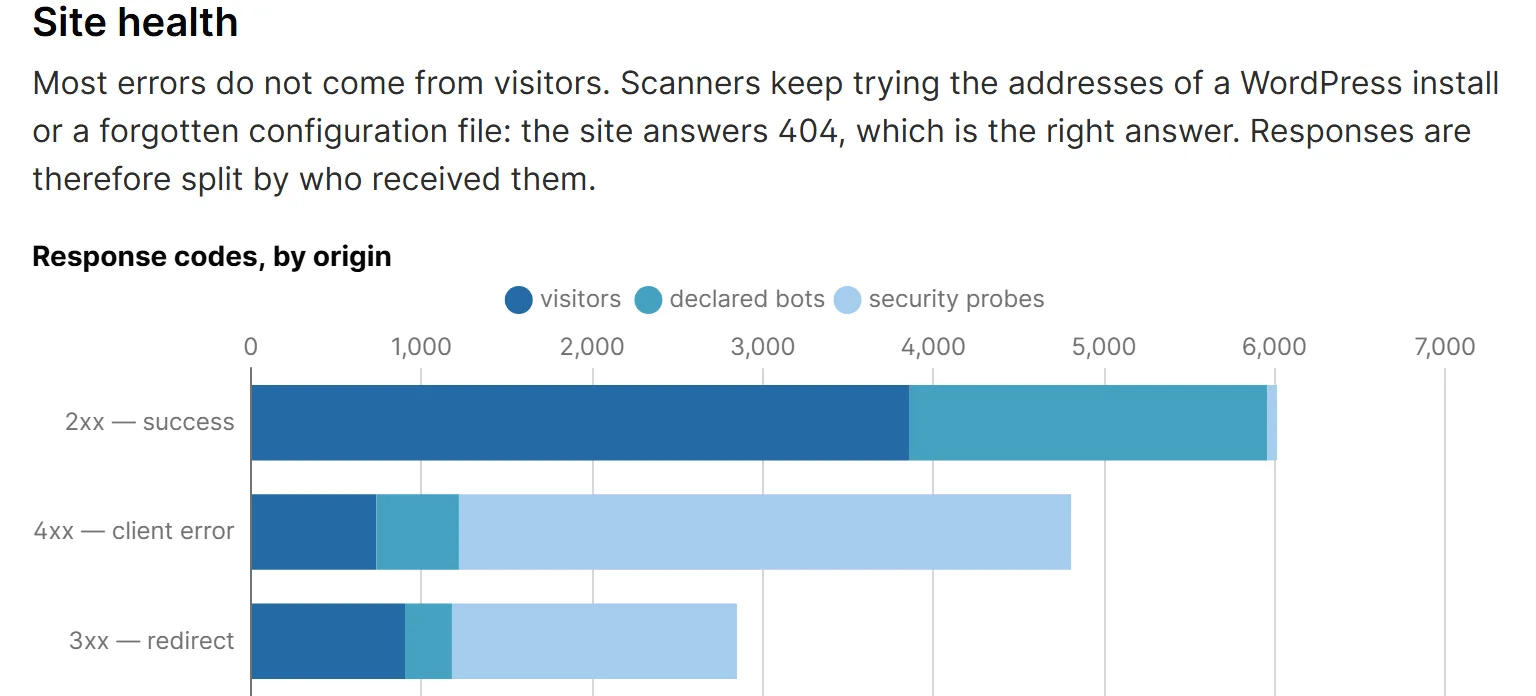
The doubt came on 16 September, from a secondary section of the dashboard, "Site health", which showed a lot of errors. I first looked for a dead link. There were none. What I was seeing were scanners hitting random URLs. Nobody warned me; no tool asks the question for you. It is the same trap as in my previous article, about going from demo to production: plausible, fluent, wrong. Except that here it concerns numbers, not text.
Three corrections
The first correction was the crudest. Requests for /wp-login.php or /.env, on a site that has never run on WordPress. Those identify themselves. Less obvious: my own redirects. The server answered these probes with a 308, and those responses were counted as visits, around 900 of them on their own. Excluding the probes and the redirect codes takes the total from 2,517 to 1,251.
The second correction was more unsettling, because it came from me. Next (16.3) prefetches: as soon as the menu appears, it fetches every link it contains, whether the visitor clicks or not. These requests carry a ?_rsc= parameter in the URL, but so does a genuine click; what gives a prefetch away is a header of its own. 639 of them were prefetches, and three more probe patterns turned up along the way. In other words, half of what remained was traffic my own site was generating for itself. 1,251 becomes 656.
The third correction is the only one that needed a real criterion. Many bots declare themselves as Chrome; the User-Agent proves nothing, it can be copied in one line. So I relied on what a script imitates badly: the Sec-Fetch-* headers, sent by every mainstream browser since March 2023, and the fact that a real visitor either negotiates HTTP/2 or also loads the page's CSS and JavaScript. The test takes half a page, not three lines, because the real work is not to throw out a legitimate visitor. Result: 110. The home page alone drops from 465 views to 58. The clue was visible before the filter: it was seen from 269 networks, against about twenty for any other page on the site. Comparing pages with each other would have tipped me off much earlier.
What the 110 does not say
That figure of 110 is an underestimate by construction, and I would rather say so. A Safari older than March 2023, or a proxy on HTTP/1.1 with a full cache, falls through the cracks. Two people behind the same router count as one network.
It is also inflated by someone I know well. One network stands out: 24 of the 110 views in the first month, and 137 of the 345 counted by 12 October, nearly two in five, spread over seventeen different days. That is almost certainly me, publishing and proofreading. I cannot prove it from the logs, so I do not filter it out; I would rather say it than hide it behind a rule built on a guess.
And two counters coexist without agreeing. The Monday GoAccess report announced 2,560 requests for the week of 21 to 27 September. For the same week, the dashboard counts 36 page views from 7 networks, 19 of them from mine. GoAccess is not wrong, it counts something else: requests rather than page views, with only the bots that declare themselves filtered out, so none of the three filters above. The reference is the Evidence dashboard.
Last episode, 28 September. Rereading it all, I realised the database had been frozen on the 16th: eleven days of logs never pulled in, even though the corrections were in place. A dashboard that is right but stale is no better than one that is wrong. After rerunning the collection: 198 page views, 55 networks, zero dead links, over 44 days. The chain is not automated, and that is the next job.
The test: two LinkedIn posts
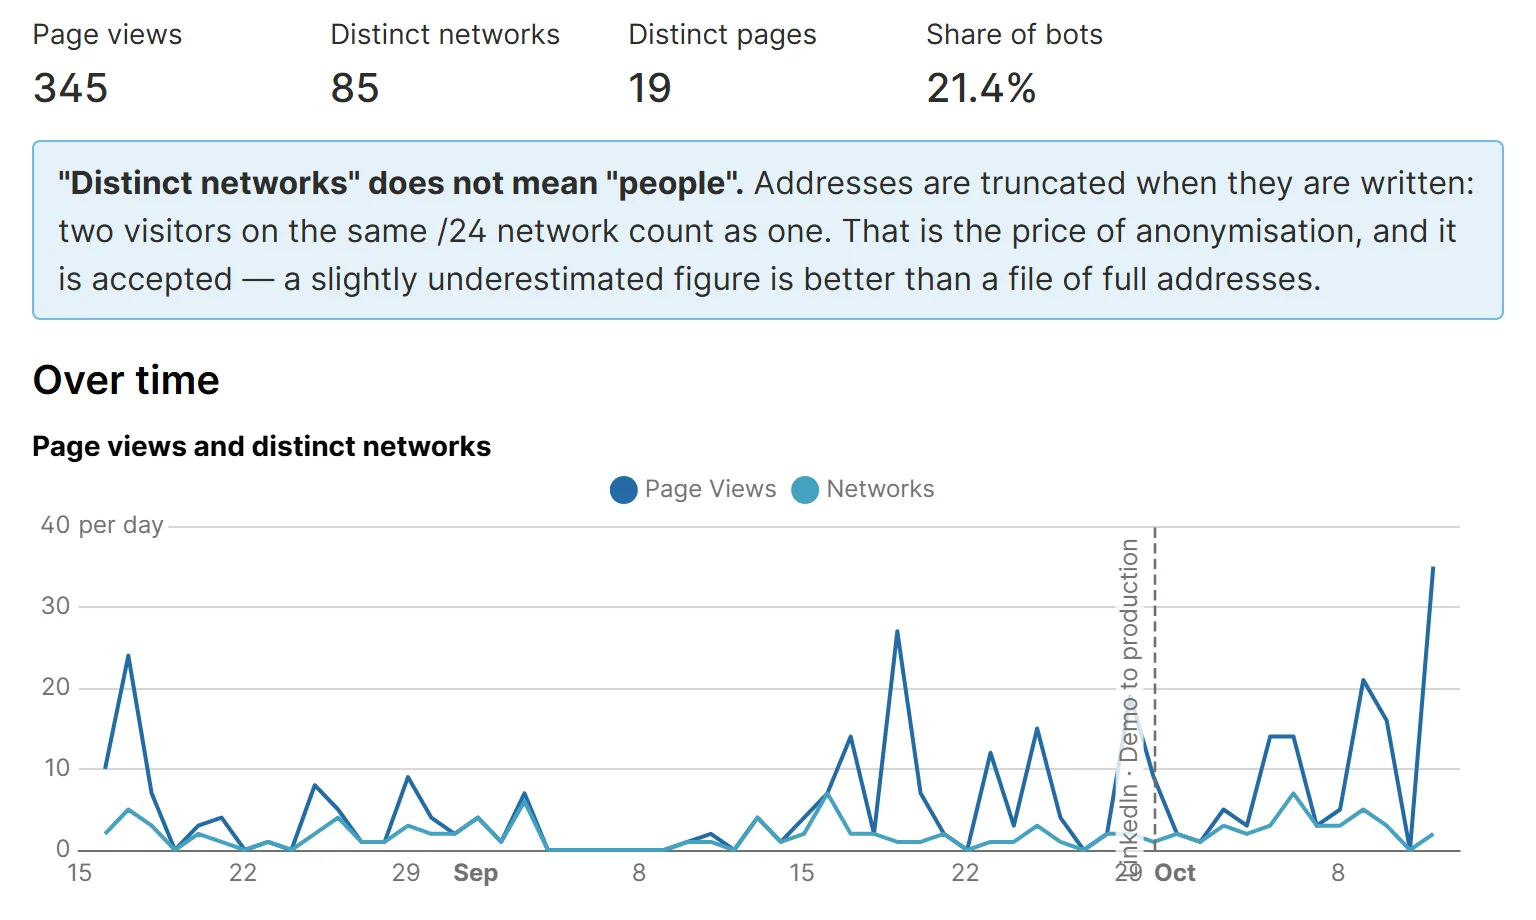
In September I posted two articles on LinkedIn: HORIZON first, then the previous one about this site. LinkedIn does not give me the exact time, so I take the logs' word for it: the first visit from LinkedIn to the HORIZON article arrives on 24 September. Leaving my own network aside, the fourteen days before that date brought 28 page views from 19 networks. The fourteen days after, 62 from 28. Since then, each of the two articles has been read from five networks.
In two months of logs, exactly four visits say they come from LinkedIn. The app often sends no referrer, so the rest could be readers of the posts, or a new bot that slips through the filter, and without a tracker I cannot tell which. That is the price of the choice, and I would make it again. A site that is starting, measured honestly, gives small numbers. That is not a failure of the measurement.
What I would do differently
Compare pages with each other before looking at a total, because it was the gap between the home page and the rest that gave the bots away. Document every filtering rule with the date and the version that motivated it, otherwise it becomes incomprehensible within six months. And schedule the collection from day one, not afterwards.
On 12 October, the dashboard reads 345 page views from 85 networks. Nearly two in five are mine.