Enhance your business analysis with custom Power BI reports
- With over ten years of experience in the betting industry, I have honed my skills in reports building, stakeholder engagement, and problem-solving.
- Clear and transparent data analysis is provided through advanced reporting solutions, specializing in automated Power BI reports that seamlessly connect to various data sources, including SQL databases, websites, CRMs, and local files.
- Tools like M command, DAX, and AI are utilized to ensure the best possible outcomes, tailored to specific visual needs.


Find answers to your questions here
Data Analysts
Data Sources
Power BI
Reports
1What is a Data Engineer?
Data Engineers configure and manage data platforms, both on-premise and in the cloud, ensuring secure and seamless data flows from various sources, including relational and non-relational databases, data streams, and file stores. They use data services and tools to ingest, export, and transform data, collaborating with business stakeholders to meet data requirements and design solutions.
2What does a Data Analyst do?
3What is the role of a Business Analyst?
A Business Analyst although similar to a data analyst, focuses more on interpreting data from visualizations with a closer connection to business operations. They specialize in translating data insights into actionable business strategies. In many cases, one person can take on the responsibilities of both a data analyst and a business analyst.
4And what about a Business Intelligence Analyst?
A Business Intelligence Analyst focuses on analyzing data to provide actionable insights that support strategic decision-making. They collect, clean, and analyze complex datasets, developing reports, dashboards, and visualizations using tools like SQL, Tableau, or Power BI. Key skills include strong data analysis and statistical abilities, proficiency in BI tools and query languages, and the ability to interpret data to extract meaningful insights. Collaborating with stakeholders to understand their data needs, they help drive business strategies based on data findings.
5What is a Data Scientist?
Data Scientists perform advanced analyses to extract value from data. Their work can range from descriptive analytics to predictive analytics. Descriptive analytics assesses data through a process called Exploratory Data Analysis (EDA). Predictive analytics, used in machine learning, applies modeling techniques to detect anomalies or patterns. These analyses are key components of forecasting models.
1Flat Files
Organizations often store their data in flat files, which contain a single structured table without hierarchy. The most common formats are CSV files, delimited text files (.txt), and fixed-width files. Excel files (.xlsx) are also used for data export.
2Databases
Use Power BI Desktop to connect directly to your sales database without relying on flat files. This connection allows you to track business performance, identify trends, forecast sales, and plan budgets. Power BI Desktop supports many relational databases, whether in the cloud (Azure, AWS, etc.) or on-premise (MS SQL Server, MySQL, Oracle Database, etc.).
3Online Services
Organizations rely on various software applications like SharePoint, OneDrive, Dynamics 365, or Google Analytics for their daily operations, generating specific data. Power BI enables the merging of this data from multiple sources, providing more relevant insights and enhanced reports.
4Power BI and its Connectors
Power BI supports over 100 connectors for various data sources, including online services. For example:
- Salesforce and Dynamics 365 for CRM data.
- Google Analytics and Adobe Analytics for marketing analytics.
- SharePoint Online and OneDrive for content management.
Power BI also connects to websites via APIs, such as Twitter and GitHub, to extract and analyze real-time data.
1Integration with Microsoft 365
Power BI seamlessly integrates with other Microsoft tools like Excel, SharePoint, and Teams. This allows organizations to leverage a unified ecosystem, reducing costs and training efforts while increasing operational efficiency.
2Advanced Visualization Capabilities
Power BI offers dynamic, interactive visualizations that help transform complex data into clear, understandable insights. This enables decision-makers to quickly make informed choices based on intuitive visual data.
3Connection to a Wide Range of Data Sources
With over 100 connectors available, Power BI can connect to diverse data sources such as Salesforce, Google Analytics, or SQL databases. This ability to centralize data simplifies analysis and provides a comprehensive view of business performance.
4Real-Time Analytics
Power BI enables real-time analysis, which is crucial for businesses needing to monitor key metrics continuously. For example, sales data or marketing campaign performance can be tracked live, allowing for rapid adjustments when necessary.
5Flexible Pricing
Power BI offers pricing options tailored to the needs of small, medium, and large businesses. Its flexible plans allow organizations to start small and scale up as their needs evolve, ensuring an optimal return on investment.
1Interactive and Dynamic Reports
Power BI reports offer advanced interactivity, allowing users to filter, zoom, and dive deep into the data. This ability to manipulate data in real-time enhances decision-making by providing tailored insights specific to each user’s needs.
2Automatic Data Updates
Power BI reports can be configured to automatically update from various data sources, ensuring that users always work with the most up-to-date information. This automation reduces the need for manual interventions and minimizes the risk of human error.
3Customization with Third-Party Visuals
Power BI allows the integration of custom visuals through the marketplace, offering great flexibility to tailor reports to users' specific needs. This enables the creation of visually unique reports that meet precise business requirements.
4Easy Collaboration
Power BI makes it simple to share insights across the organization, fostering cohesion and ensuring all team members are working from the same updated data.
5Natural Language Query (Q&A) Feature
Power BI offers a natural language query feature that allows users to ask questions about their data in simple terms. This ability to query reports without technical expertise improves data accessibility, making insights actionable for a broader range of users within the organization.
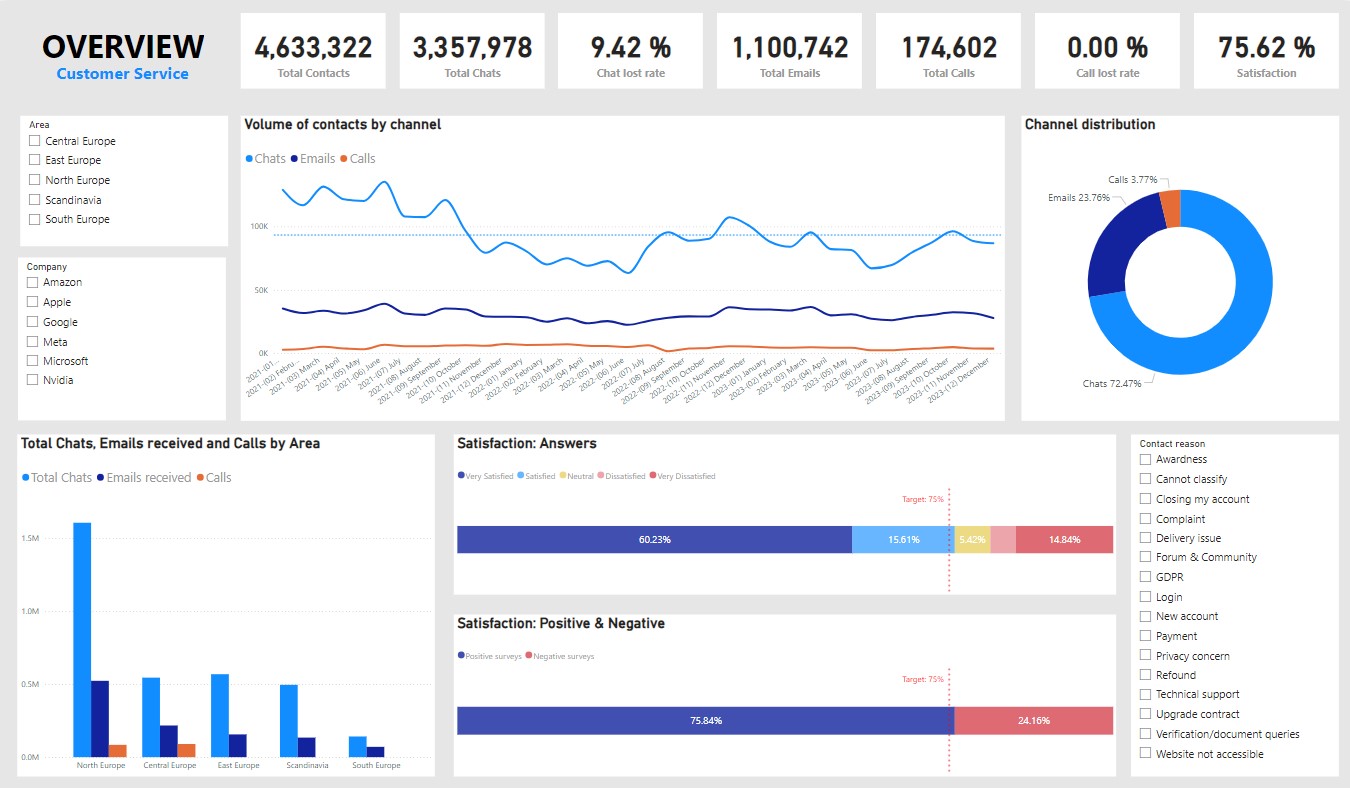
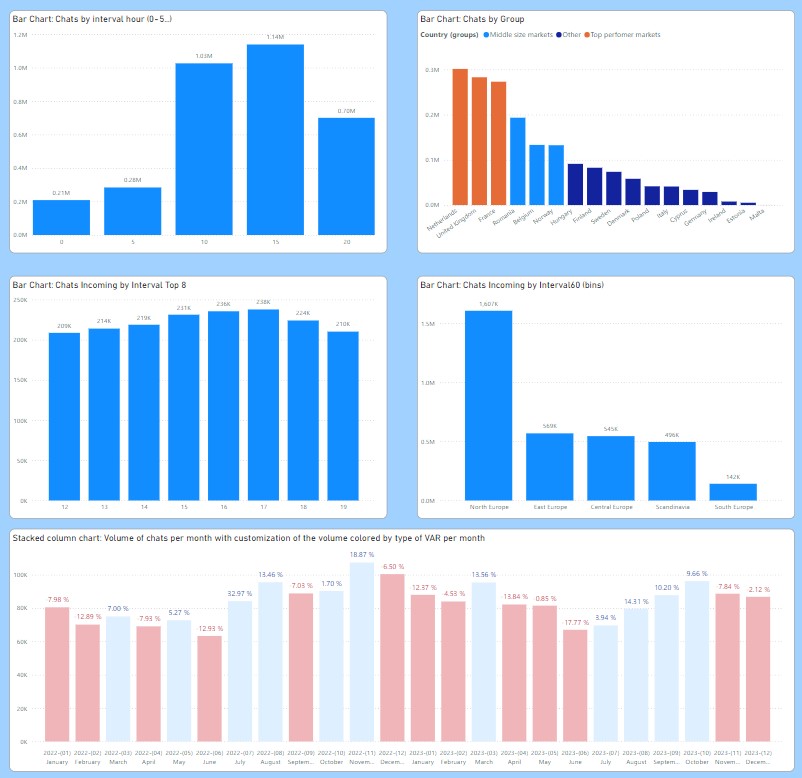
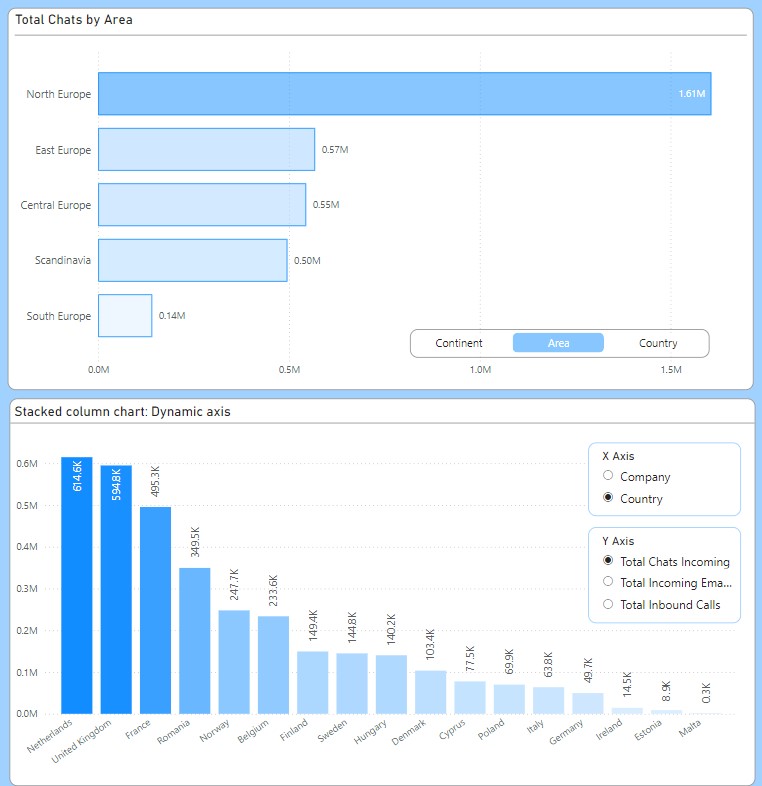
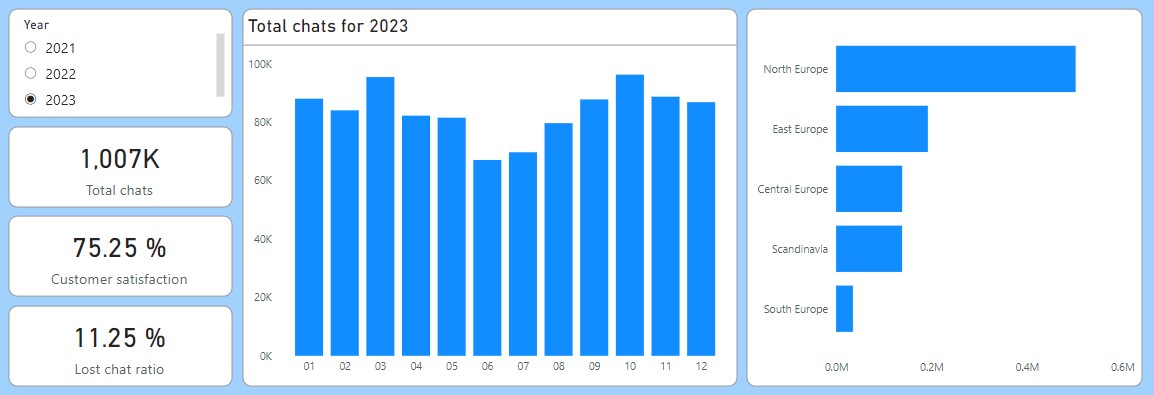
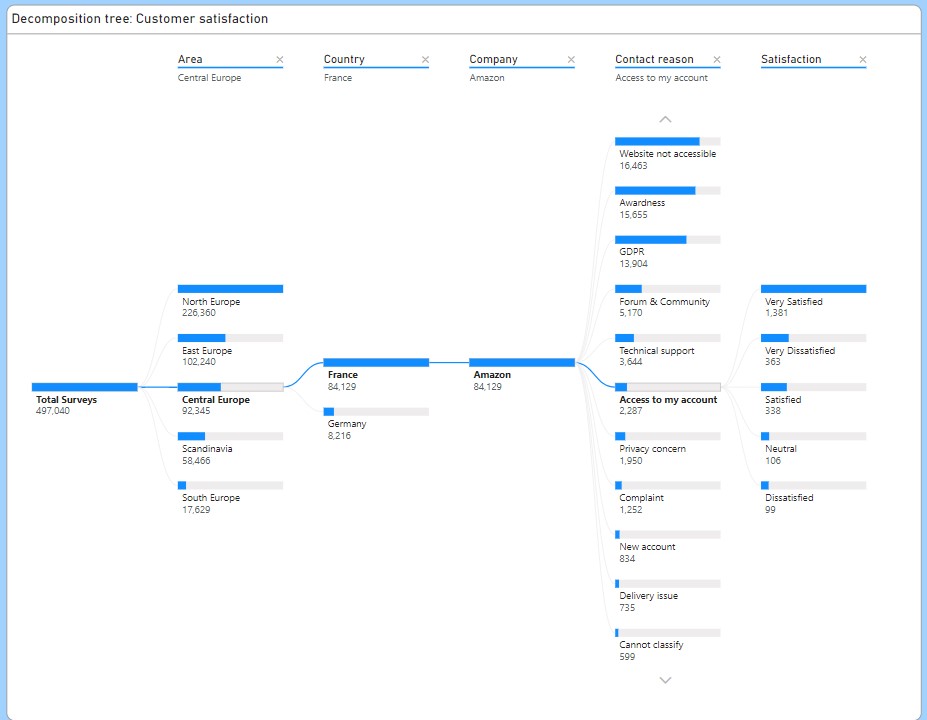
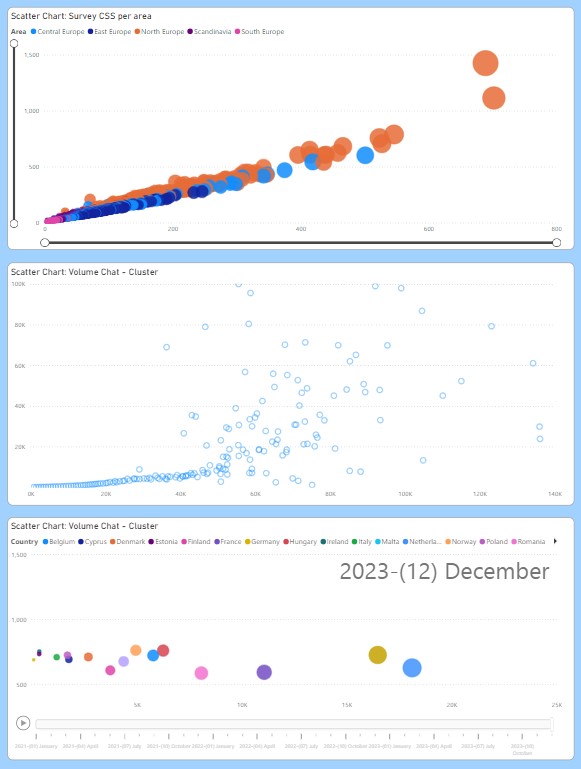
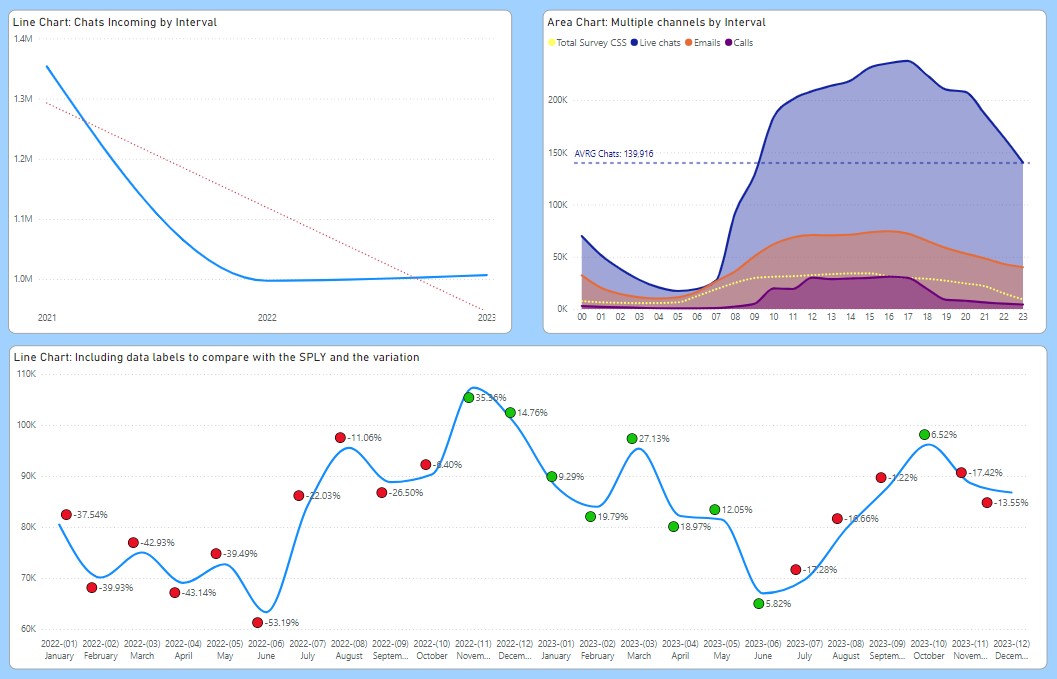
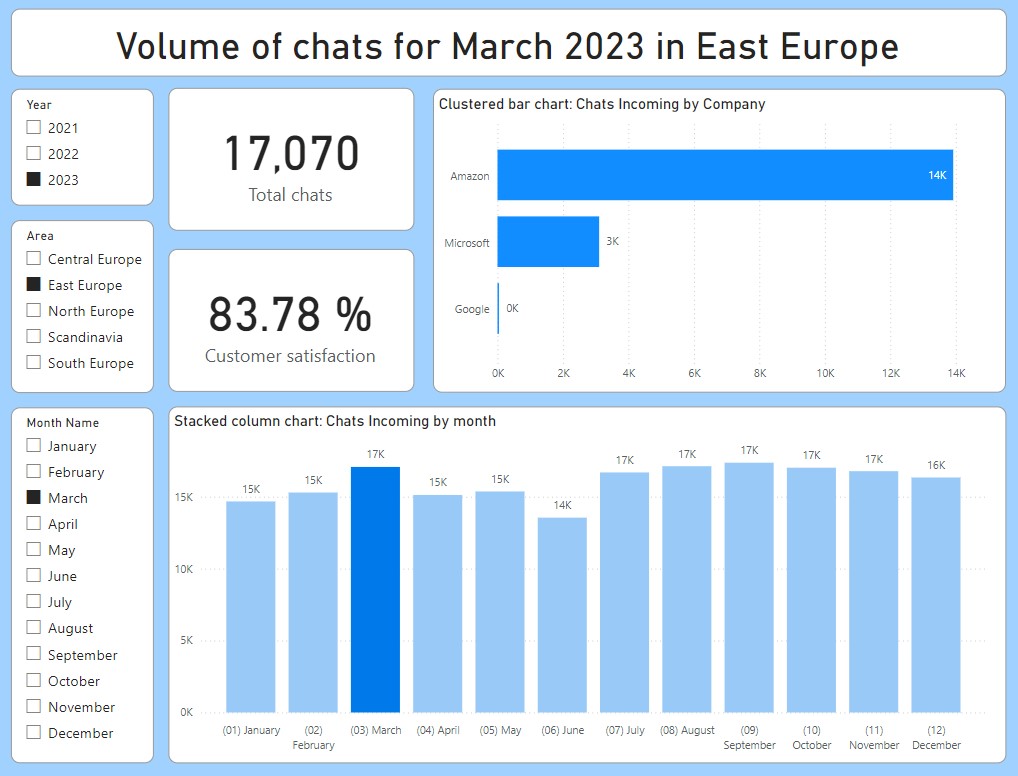
“All charts, reports and visualizations are developed with Power BI Desktop and hosted on Power BI Service.”